Preparing for a flood event
Before a flood event, flood mapping and information helps inform emergency preparedness planning.
Flood mapping and information is used to help inform emergency preparedness planning. The mapping helps our community Get Ready.
As storm season approaches, it’s a good time to check your property online using our emergency preparedness mapping.
We encouraged you to look at locations like home, work, or where friends and family members may go to school. Look at how flooding affects the routes often travelled. It’s important to have a backup plan or know the alternative routes you can take.
Think about how your property might be affected by different flood events. Consider any changes you might need to make to prepare for flooding now or in the future and increase your own resilience.
Community awareness and education
Flood mapping helps you understand how flooding and overland flow may affect aspects of your everyday life, at home, at work, at school or on the road. Understanding and acting on this information helps build a strong and resilient community.
Historically, most Queensland towns and communities were established on or near a floodplain. As a result flooding is likely. With this in mind, understanding flood risks to your property and your local area, helps build community resilience to possible flood events.
Types of flooding
Riverine flooding
Riverine flooding
Riverine flooding normally results from widespread and prolonged rainfall over larger catchment areas. Riverine flooding typically occurs when water escapes from the confines of a waterway or waterbody onto land that would normally be dry. As catchments get larger the duration, that this land can be inundated, gets longer. On the Sunshine Coast it can be up to several days.
Flash flooding
Flash flooding
Flash flooding can also occur following intense localised rainfall and with little warning. Flash flooding is dangerous. It is often characterised by powerful, fast moving water.
In built up, urban areas rainfall can turn to overland flow run off very quickly. Streets, roads and drains are designed to convey water and sections can become deep or pond water for extended periods. Runoff that forms in private property and in parks will appear as torrents of water.
In areas with buildings, the buildings can channelise this runoff, which can make the velocity of the water faster and more hazardous. Flash flooding often occurs with severe storms.
Storm surge and storm tide
Storm surge and storm tide
Storm surge is the persistent rise above the normal tide level. Storm tide is the combined effect of a storm surge and the normal astronomical tide.
A storm surge can be produced by strong onshore winds and or reduced atmospheric pressure from a large-scale severe weather event. The worst storm tide condition occurs when the peak storm surge coincides with a high tide.
Know how flooding can affect you
Disaster Hub is Councils emergency dashboard. It can also be used to help our community's emergency preparedness for events like flooding.
The mapping information provided on Disaster Hub can help you understand:
- What is the flood risk at my place?
- Could my property be flooded?
- Could my street, suburb or locality be cut off by flood waters?
- Where would I go if I needed to evacuate?
- Which flood warning gauge is most relevant for me?
Riverine flood maps (minor, moderate, major and extreme flood events)
Riverine flood maps (minor, moderate, major and extreme flood events)
Disaster Hub provide Riverine Flood Hazard maps for different size (minor, moderate, major, extreme) flood events. These flood maps incorporate flash flood and storm tide. The maps use flood depth and velocity information to show the flood hazard. Hazard is an indicator of how dangerous the flooding could be. The maps highlight how the hazardous nature of flooding gets worse as the size of the flood gets larger.
Disaster Hub only allows one size flood event to be selected at a time. When a different size flood event is selected, the previous selection is de-selected.
The size of each flood event is determined by the likelihood of the event occurring. Whilst the likelihood of an event occurring in one year may be small, it becomes more significant when the likelihood is considered over a longer period.
Minor flood likelihood: 40% annually 100% over 70 years
Moderate flood likelihood: 10% annually 99.9% over 70 years
Major flood likelihood: 1% annually 50% over 70 years
This distinction is important when considering the likelihood of experiencing flooding in a lifetime or within the design life of a building.
Stormtide maps (storm surge maps)
Stormtide maps (storm surge maps)
When a storm event is likely to affect our region, the Bureau of Meteorology provides advice to the Council and the Local Disaster Management Group on the likely size of the storm tide. It does this by indicating the estimated elevation of the storm tide event above highest astronomical tide (HAT).
Council has prepared storm tide mapping for 0.5m (red), 1m (orange) and 1.5m (yellow) elevations above storm tide.
Within Disaster Hub these are combined to be presented as a single Stormtide Hazard map.
During a flood event - Disaster Hub
During a flood event, Disaster Hub is an important source of information.
Disaster Hub maps for flood emergencies
Disaster Hub maps for flood emergencies
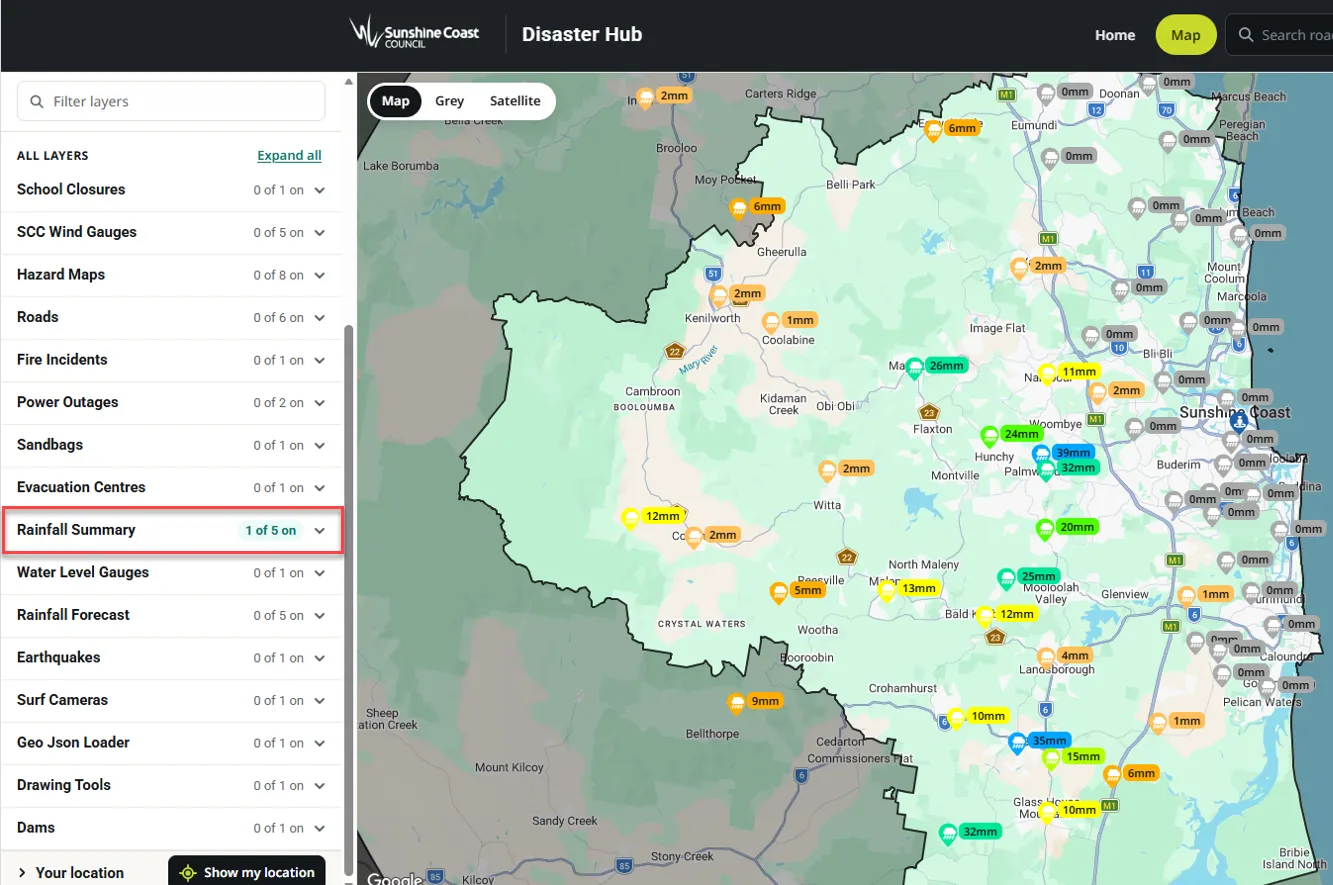
- Flood Monitoring System Rain gauge summaries for the last 1, 3, 6, 12 and 24 hours.
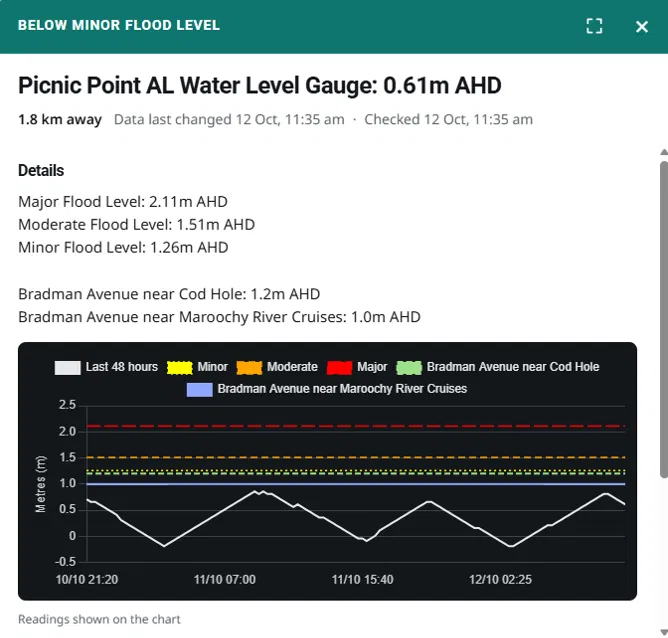
- Flood Monitoring System Water Level gauge information for the last 48 hours.
- Forecast rainfall information from the Bureau of Meteorology.
- Listings of local and State roads closed.
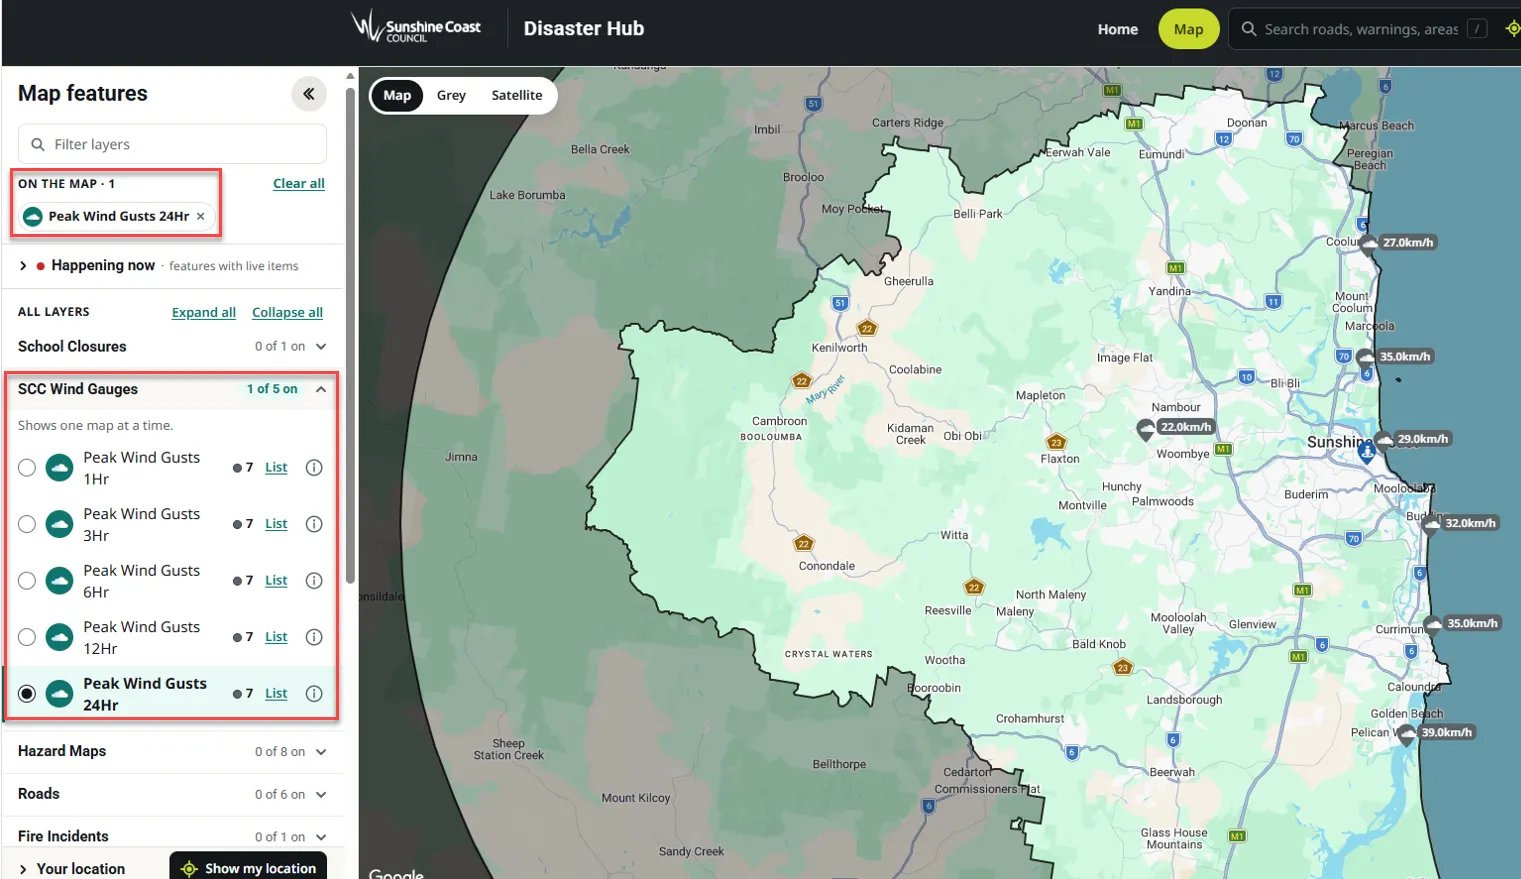
- Peak wind gust summaries for the last 1, 3, 6, 12 and 24 hours.
- Notifications of heavy rainfall at Flood Monitoring System gauges.
- Notifications of Bureau of Meteorology Severe Thunderstorm Warnings.
Flood Monitoring System water level gauges
Flood Monitoring System water level gauges
The last 48 hours of information from a Flood Monitoring System water level gauge can be viewed by:
- selecting a specific gauge on the map
- viewing the water level relative to water levels that relate to the Minor, Moderate and Major Flood Hazard Maps.
This allows the gauge water levels to be used in combination with the pre-prepared hazard mapping during an event, by selecting the map classification which closest matches the water level.
Water Level gauge information is provided in Australian Height Datum. This is intentional, as it allows direct comparison with infrastructure, such as road, bridge deck or floor levels. Notifications occur when the water level at a gauge exceeds the water level of the minor, moderate, major flood hazard map at the gauge location.
Rainfall summaries
Rainfall summaries
Near real-time access to rain gauge information from the Flood Monitoring System is available. It is summarised for the last 1hr, 3hr, 6hr, 12hr and 24hr totals.
In a thunderstorm the shorter duration summaries can be useful to show locations currently or recently affected by the thunderstorm.
Flash flood notifications on Disaster Hub
Flash flood notifications on Disaster Hub
When rainfall intensities become a concern for flash flooding a Disaster Hub notification will occur indicating the gauge and nearby locations that could be affected. Disaster Hub notifications also include Bureau of Meteorology Severe Thunderstorm warnings.

Wind gauges
Wind gauges
During a Cyclone or other events with damaging winds, you can view summaries of wind gust information on Disaster Hub.
The information from these gauges can be compared to the strongest gust indicators of Tropical Cyclone categories.